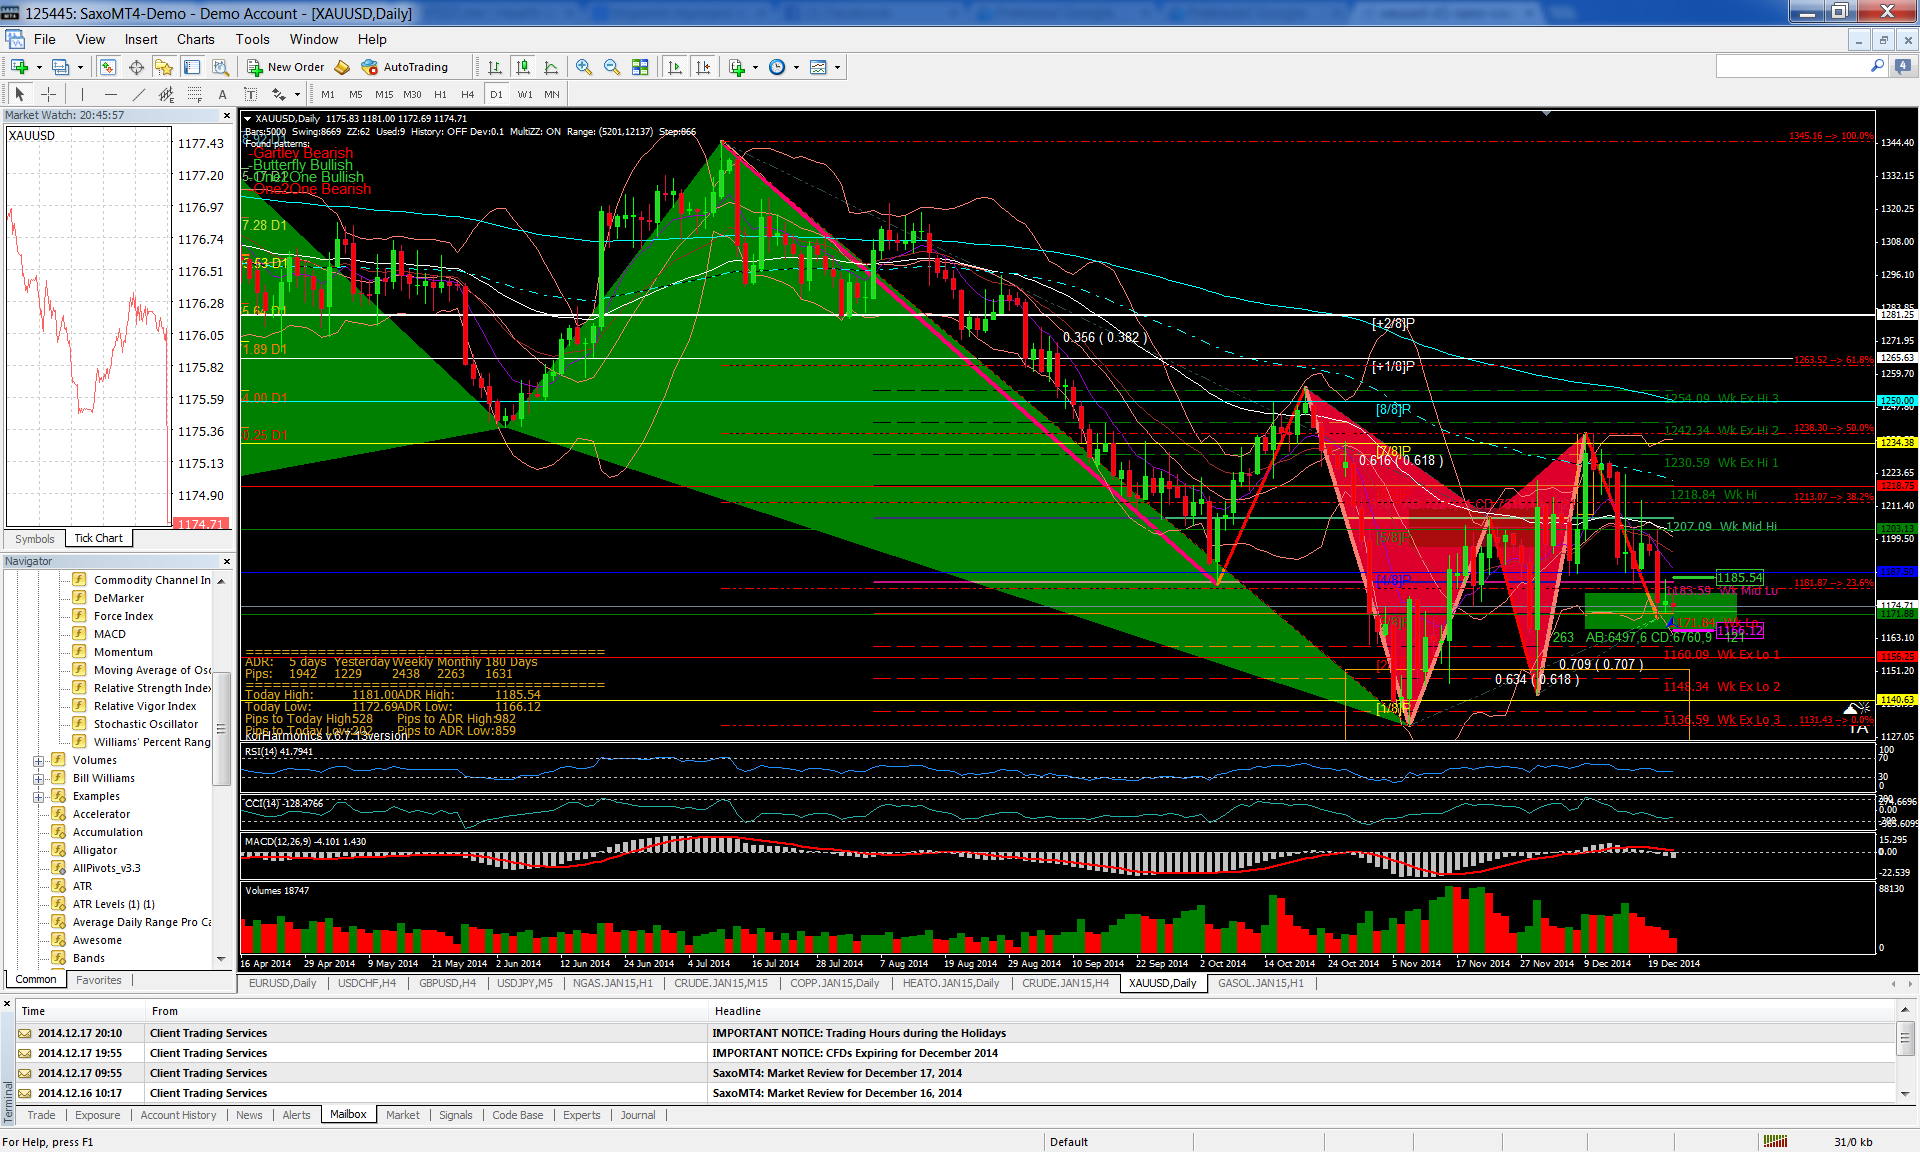
Crude oil – where is the price bottom? 15-25 USD?

The oil and its price have been widely discussed for months. Watching the oil price falling lower and lower and its impact on the markets, people are wondering where might be the price bottom. Let´s analyze the circumstances.

Crude oil – weekly storage report:

crude oil weekly storage report finilacomincrease of stocks
356 635 thousand barrels – September 26, 2014
494 920 thousand barrels – January 26, 2016 – new record, all time high


Crude oil – production, rig counts:

crude oil rig counts production finilacomoil production is still high despite of decreasing rig counts


Net position of managed money:

crude oil net position of managed money finilacomdecrease of positions
184 317 – October 13, 2015
69 755 – January 12, 2016
110 432 – January 26, 2016 – maybe gradual start of long buying by managed money, we will see later if it will continue


Chart – crude oil

Murrey math lines
monthly chart 1/8 – Fast reverse line – support: 25 USD
4H chart, daily chart 3/8 – Lower trading range – resistance: 34,38 USD, 1/8 – Fast reverse line – support: 28,13 USD, 0/8 – Hardest line to fall below – support: 25,01 USD, -1/8 Oversold line – support: 21,89 USD,  2/8 minimum of scale – support: 18,77 USD

Moving average EMA200
4H chart – 34,38 – resistance

Harmonics pattern
monthly chart – end of reversal zone 16,62 USD
wti-mn1-finilacom


minimum from 1998 – spot price about 10 USD, real price (inflation adjusted) 14-15 USD

crude oil chart real price finilacom


Summary: the bottom price of crude oil could be around 20 USD ( 15-25 USD)

Live cattle – up or down?

Net position of managed money:

increase of positions
47232 – February 17, 2015
95957 – May 26, 2015

Cattle on feed – weekly report:

Cattle and calves on feed for slaughter market in the U. S. for feedlots with capacity of 1,000 or more head totaled 10.6 million head on May 1, 2015. The inventory was 1 percent above May 1, 2014.

Placements in feedlots during April totaled 1.55 million, 5 percent below 2014. Net placements were 1.48 million head. During April, placements of cattle and calves weighing less than 600 pounds were 320,000, 600-699 pounds were 240,000, 700-799 pounds were 348,000, and 800 pounds and greater were 640,000.

Marketings of fed cattle during April totaled 1.64 million, 8 percent below 2014. Marketings in Apri are the lowest since the series began in 1996.

Other disappearance totaled 66,000 during April, 20 percent below 2014.

Chart – live cattle

August contract Murrey math lines

monthly 4/8 – Major reversal line – Major Support/Resistance

August contract: monthly – Symmetrical triangle

CFD: daily – Ascending triangle, monthly – double top

live cattle daily 2015-06-01 cfd finilacom


live cattle monthly 2015-06-01 cfd finilacom


End of swiss franc cap – extreme moves, USD/CHF, EUR/CHF technical and fundamental analysis

technical analysis:

– more interesting is USD/CHF chart  (despite the fact that everyone is talking about EUR/CHF)

– announcement of Swiss National bank concernig end of cap… from 1,02389 USD/CHF ( selling opportunity):

a/ bearish harmonics weekly zone (gartley bearish) -see featured image – USD/CHF weekly chart.

b/ murrey match last line +2/8 is 1,02539 USD/CHF – great daily resistance

– then huge fall to 0,77792 USD/CHF (murrey line – major line 4/8 is 0,78125 – on weekly and monthly chart – see featured image) – it was great weekly and monthly support

– then correction (buying opportunity) to 0,87891 USD/CHF (daily murrey line 4/8 – major line)

USD/CHF daily chart:

usd-chf-daily-chart-cap

EUR/CHF monthly chart:

eur-chf-monthly-chart-cap

fundamental analysis:

 In September 2011 the Swiss central bank put in place a ceiling of CHF 1.20 per euro to stop the currency’s appreciation, which was causing problems for Swiss exporters, among other things. On 15th January (morning) – to general surprise – it abandoned the ceiling. It also cut a key interest rate from -0.25 percent to -0.75 percent, raising the amount investors pay to hold Swiss deposits. It appears to have done so because of an expected sovereign bond buying programme from the European Central Bank in the next few days. That, in turn, is expected to increase demand for safe haven currencies like the Swiss Franc, and the Swiss National Bank – the central bank – seems to have decided that it just would not be able to defend its self-imposed ceiling in the circumstances.

A central bank does not act in such a dramatic way very often. It’s a once in a blue moon event and it has taken the currency markets by surprise. This was the biggest FX shocker in years.

It was the extraordinary climb of 30 perc by the Swiss Franc, one of the world’s most important safe haven currencies, against the euro. At one stage, it was up 39 percent against both the euro and the dollar. Movements like this simply don’t happen in big, widely held currencies like the Swiss franc.

Major currencies rarely move more than 1 – 2 percent in a short period, investors are able to borrow large sums to juice their bets.

When the Swiss bank’s decision was announced, the euro fell almost instantaneously from 1.2009 Swiss francs a euro to 1 with barely any opportunity to trade in between. From there, it hit 0.9750 and then 0.85 before rebounding somewhat.

The move was  extreme

What does it mean for investors? In the short term, volatility and great losses; in the longer term, the Swiss franc-euro pair will presumably settle. Maybe about 1:1. For shareholders, it’s not good news for Swiss exporters, who have just seen their goods become thirty percent more expensive to European buyers in the space of an hour or so; Swatch, for example, saw its shares fall 16 percent, and Switzerland’s main equity benchmark, the SMI, fell 7 percent on the news. The big Swiss banks, Credit Suisse, UBS, and Julius Baer, all tumbled too.

Gold daily patterns confirmed – harmonics, fibonacci, murrey lines

Gold daily patterns confirmed – harmonics, fibonacci, murrey lines

technical analysis:

– confirmed daily support harmonics (butterfly bullish) 1131,43 usd, also murrey line 1/8 1140,63– possible 3,91 usd

– then nice pullback to 50% fibonacci retracement with harmonics (gartley bearish) and murrey match line 7/8, resistance 1238,30 usd

– now small support 1171-1173 usd ( harmonics zone + murrey line 3/8)

fundamental analysis:

Data showed the US economy grew at a 5.0 per cent clip in the 3rd quarter, its quickest pace in eleven years and the strongest sign yet that growth has decisively shifted into higher gear. Gold was trading close to a 3-week low on Wednesday as strong US economic growth boosted equities and the dollar, weakening safe-haven bids for bullion.