
The pivot point is the level at which the market direction changes for the day. Using some simple arithmetic and the previous days high, low and close, a series of points are derived.These points can be critical support and resistance levels. The pivot level, support and resistance levels calculated from that are collectively known as pivot levels. Because so many traders follow pivot points you will often find that the market reacts at these levels. This give you an opportunity to trade.
The pivot points calculation formula (with using previous days high, low and close) :
Resistance 3 = High + 2*(Pivot – Low)
Resistance 2 = Pivot + (R1 – S1)
Resistance 1 = 2 * Pivot – Low
Pivot Point = ( High + Close + Low )/3
Support 1 = 2 * Pivot – High
Support 2 = Pivot – (R1 – S1)
Support 3 = Low – 2*(High – Pivot)
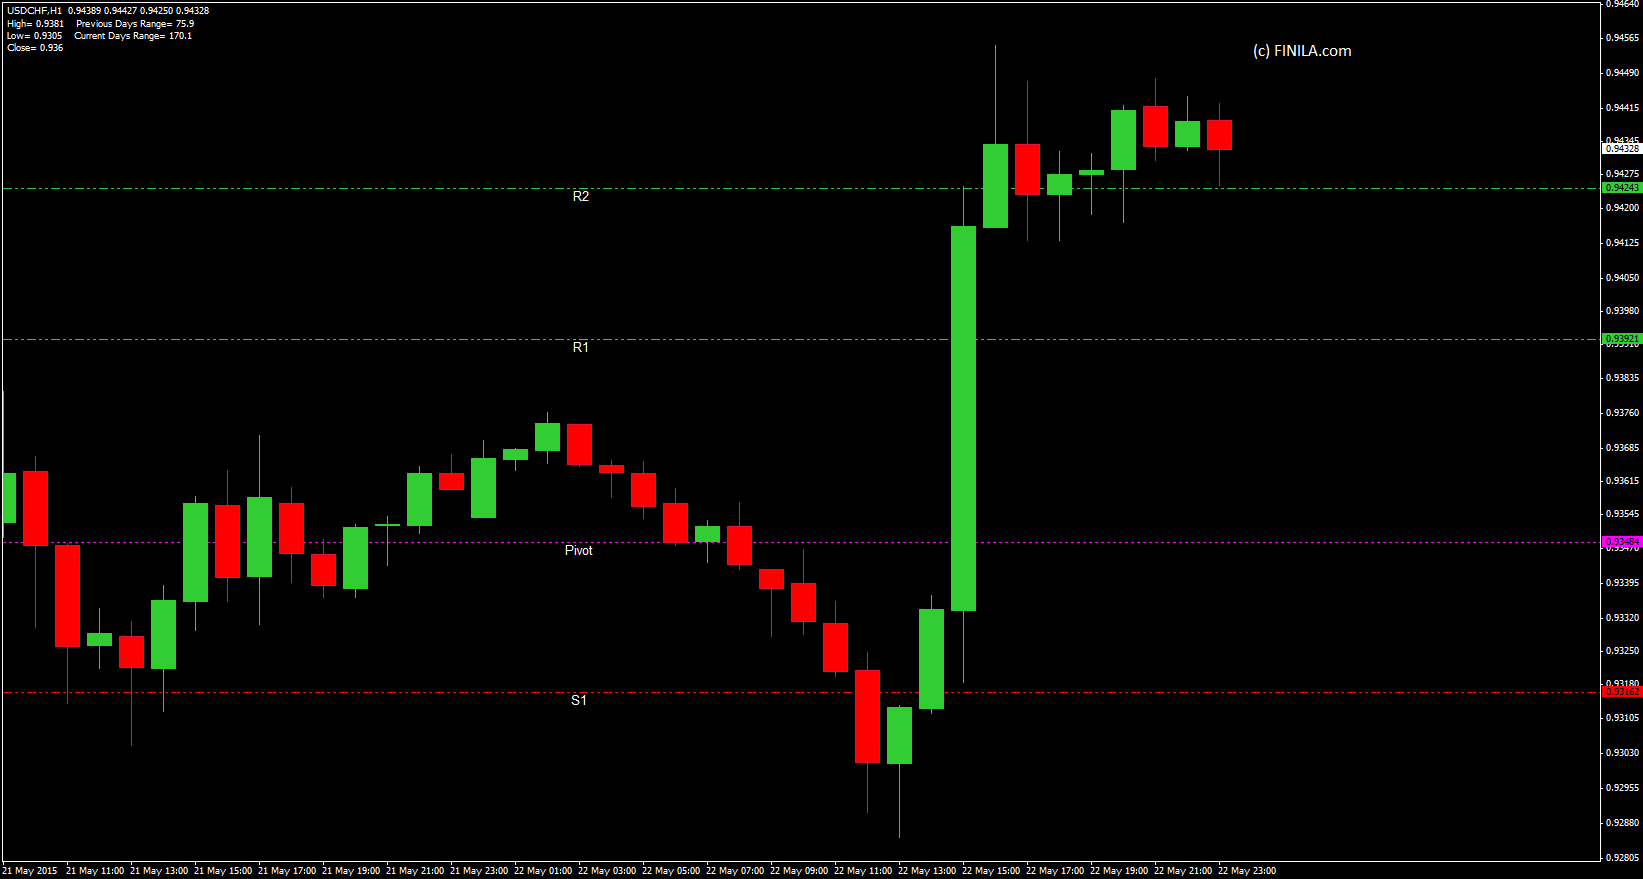
If the market opens above the pivot point then the bias for the day is long trades. If the market opens below the pivot point then the bias for the day is for short trades.
The general idea behind trading pivot points is to look for a reversal or break of R1 or S1. Then R2 and S2. By the time the market reaches R3 or S3 and more the market will already be overbought or oversold and these levels should be used for exits rather than entries. When the market reaches R3 or S3 and gets either above or below these levels, it may be a good idea to open a reversal position at these points.
The Pivot Point sets the general tone for price action. A move above the Pivot Point is positive and shows strength. Keep in mind that this Pivot Point is based on the prior period’s data. It is put forth in the current period as the first important level. A move above the Pivot Point suggests strength with a target to the resistance. A break above resistance shows even more strength with a target to the next resistance level.The converse is true on the downside. A move below the Pivot Point suggests weakness with a target to the support level. A break below the support level shows even more weakness with a target to the next support level.
Support and resistance levels based on Pivot Points can be used just like traditional support and resistance levels. The key is to watch price action closely when these levels come into play. Should prices decline to support and then firm, traders can look for a successful test and bounce off support. It often helps to look for a bullish chart pattern or indicator signal to confirm an upturn from support. Similarly, should prices advance to resistance and stall, traders can look for a failure at resistance and decline. Again, chartists should look for a bearish chart pattern or indicator signal to confirm a downturn from resistance.
Pivot Points offer chartists a methodology to determine price direction and then set support and resistance levels. As with all indicators, it is important to confirm Pivot Point signals with other aspects of technical analysis.